You’ve already proven Google Shopping works for your brand. Now the business wants more sales from it, and your founder or finance team wants to know the extra spend is actually making money.
That’s where most Shopify brands get stuck. Once you’re spending $20,000 or more a month across Shopping and Performance Max (Google’s automated campaign type), small gaps start costing real money: a ROAS target that ignores margin, a feed that sends Google the wrong signals, or tracking that counts the same order twice. Each one makes Google Ads look better than your Shopify numbers really are.
This guide is for marketing managers at Australian Shopify brands in that position. It shows you how to:
- set a return on ad spend (ROAS) target from your margin, product by product
- get that margin into Google Ads through your feed, tracking and campaign structure
- split your catalogue between Performance Max and Standard Shopping
- grow budgets without breaking your targets after Google’s August bidding change
- report growth your leadership team can trust
Anything from Google or Shopify is linked to the source, and where something is our own judgement as a Google Premier Partner and Shopify Partner, we say so. If you’re still setting up, start with our getting-started guide to Google Shopping for Shopify stores.
Quick answer: To scale Google Shopping profitably, bid to your margin, not to a revenue target. Work out break-even ROAS as 1 divided by your contribution margin, set targets by product margin tier, keep your feed and tracking clean, and set the target before you add budget. Performance Max and Standard Shopping can run side by side.
Your next step: If you’d like a second pair of eyes on your structure, targets and tracking against your own margins, you can book a free Google Ads strategy session. Otherwise, keep reading and use the tiered break-even calculator first.
Before you start, have these ready
- Your products are approved in Merchant Center (where Google keeps your product details) and at least one Shopping or Performance Max campaign has been running long enough to have conversion data.
- Cost per item is filled in on your Shopify products, on every variant if you can. We use it throughout this guide.
- You know who owns your Google Ads, Merchant Center and Shopify accounts, and who can change your feed and tracking.
- You have a rough idea of your shipping, packaging and payment fee costs per order.
A note on timing: Google’s holiday guidance says to adjust budgets and ROAS targets four to six weeks before a peak. If a major sale is inside that window, plan structural changes for afterwards and use the sections below to prepare.
Recent changes (each checked against the source on the date shown in the Sources section)
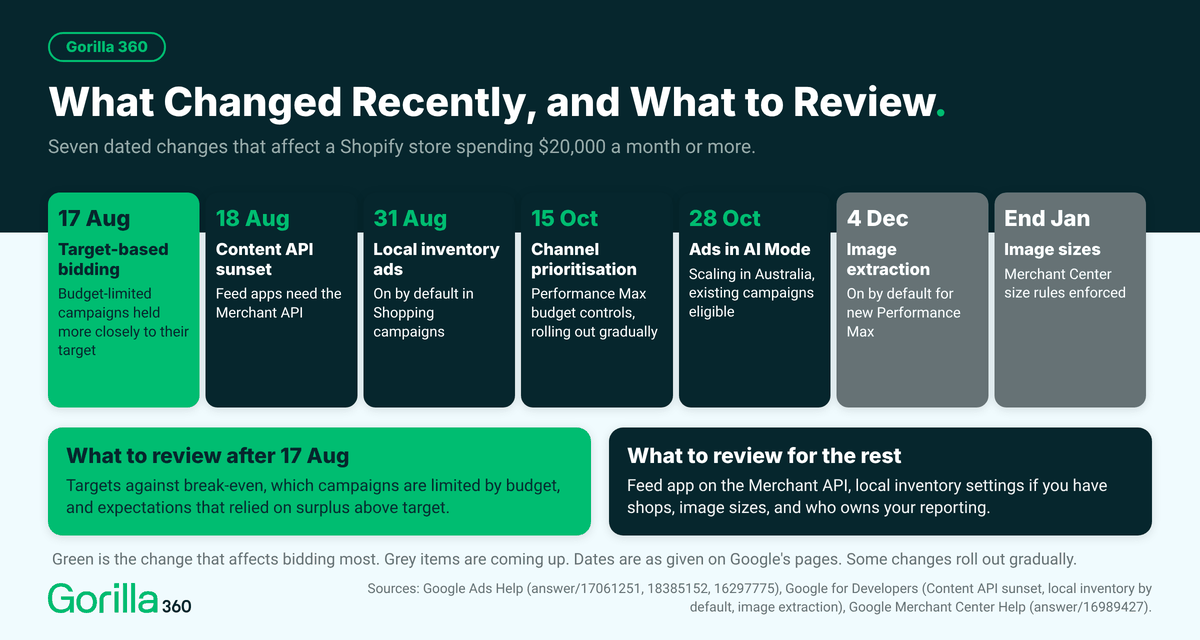
- 28 October: Google said it is scaling ads in AI Mode in Australia. Google’s help page says existing Search, Shopping and Performance Max campaigns are eligible automatically, with no separate budget, and results are included in aggregate in your usual reports. (Google blog and Google Ads Help)
- 15 October: Google began rolling out channel prioritisation and budget allocation for Performance Max. It is reaching accounts gradually. (Google Ads Help)
- 31 August: Local inventory ads now run by default in Shopping campaigns. (Google for Developers)
- 18 August: Google’s Content API for Shopping, an older way for apps to send product data, was sunset. Platform partners handle the move to the Merchant API. (Google for Developers)
- 17 August: Campaigns that are limited by budget and use a target (Target ROAS or Target CPA) are now held more consistently to that target. (Google Ads Help)
- Coming up: From 4 December, image extraction (where Google pulls extra images from your landing pages) is on by default for newly created Performance Max campaigns. Existing campaigns keep their setting. (Google for Developers) From the end of January, Google will enforce its Merchant Center image size rules. (Google Merchant Center Help)
Jump to: Work out my ROAS target · Fix my structure · Choose a feed tool · I have shops
What’s in this guide
- What does scaling Google Shopping actually mean once the basics work?
- What ROAS can you afford? Break-even ROAS and margin
- How do you get your margin into Google Ads?
- Performance Max, Standard Shopping or both: how do you split the catalogue?
- How do you set targets and budgets after the August bidding change?
- Is your feed ready to scale?
- Where does a feed app like Simprosys fit?
- Do free listings and organic Shopping still matter when you run ads?
- Are local inventory ads worth it for a Shopify store?
- How do you measure growth you can trust?
- What is a sensible order for scaling over the next 90 days?
- Scaling Google Shopping FAQ
- Sources and when this guide was last checked
Free tools and downloads in this guide (no email needed for any of them)
- Tiered break-even ROAS calculator and marginal ROAS check
- Margin tier worksheet (Excel, opens in Google Sheets too)
- Custom label map template (Excel, opens in Google Sheets too)
- Scale-readiness and target audit checklist (PDF)
- Feed app switch checklist (PDF)
What does scaling Google Shopping actually mean once the basics work?
Scaling means spending more at a return you can afford, not simply spending more. That depends on four things you control: your margin, how your catalogue is split, the target and budget you set, and the quality of your product data and tracking. Get those right and extra budget has somewhere profitable to go.
At a small budget, Google can pick the easiest sales first, and your average return looks healthy. As you spend more, Google has to reach for harder sales, and each extra dollar tends to return less than the one before it. This is why scaling is a profit question as much as a traffic question.
What is different at $20,000 a month and above?
Three things change. First, the cost of a mistake rises: $20,000 a month is about $660 a day, and $60,000 a month is about $1,970 a day (arithmetic, using a 30.4 day month). A target that is a little too generous now costs thousands of dollars a month rather than hundreds.
Second, structure starts to matter. Google’s own retail guidance says to consolidate campaigns unless your goals, budgets or ROAS targets genuinely differ, and to base a ROAS target on what will yield the highest profit, including your cost of goods sold. At this size your goals often do differ, because your products do not all earn the same margin.
Third, you have enough conversions to test properly. That is useful, but only if your tracking can be trusted.
Average ROAS and marginal ROAS: why the average hides the cost of growth
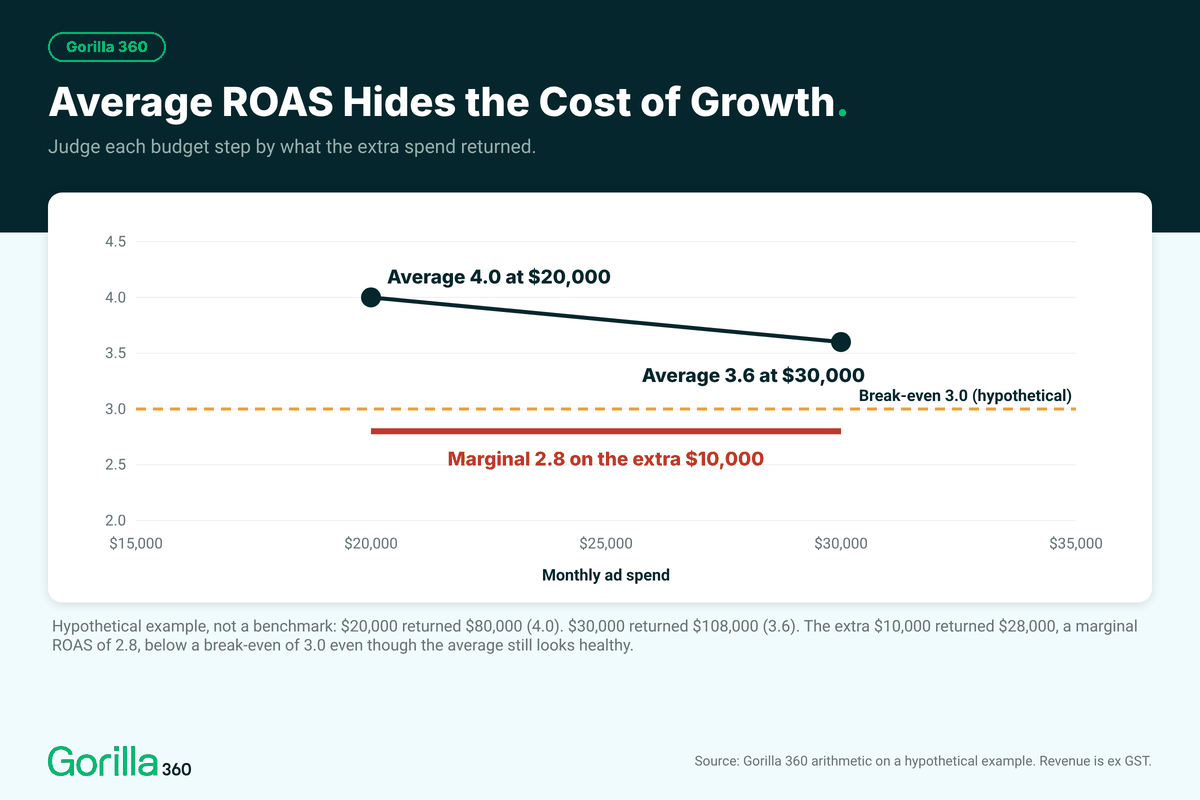
Your average ROAS is total revenue divided by total ad spend. Your marginal ROAS is what the extra spend returned. The two can be very different, and the average is the one you see in your reports.
Here is a hypothetical example to show the method (these are not benchmarks):
- At $20,000 of spend, a campaign returns $80,000. That is an average ROAS of 4.0.
- You lift spend to $30,000, and it returns $108,000. The average ROAS is now 3.6, which still looks healthy.
- But the extra $10,000 returned only $28,000 ($108,000 minus $80,000). That is a marginal ROAS of 2.8.
If your break-even ROAS is 3.0, that extra $10,000 loses money, even though the average still looks comfortably above 3.0. It’s a good reason to judge each budget increase on its own return, which is what the marginal ROAS check below does.
This also means a number we can’t give you is “a good ROAS for scaling”. We found no Australian benchmark for Shopping cost per click, conversion rate or ROAS in any source we could trust, so we don’t quote one. Your break-even, worked out below, is the number that matters.
The order we scale in
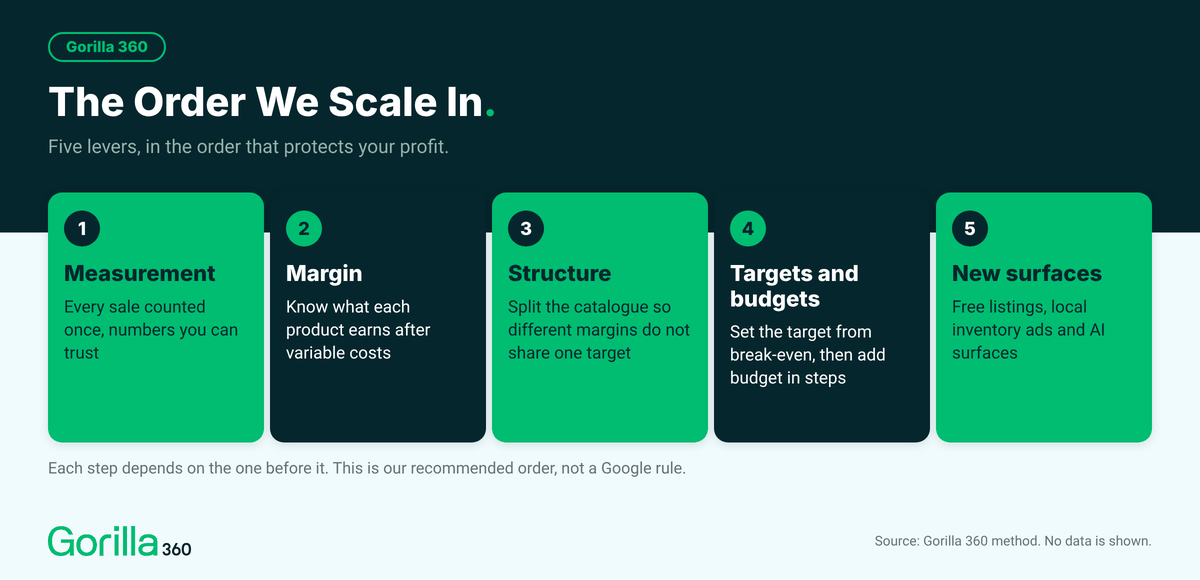
We work through five levers, in this order, because each one depends on the one before it:
- Measurement. Make sure every sale is counted once and your numbers can be trusted (section 10).
- Margin. Know what each product earns after its variable costs (section 2 and section 3).
- Structure. Split the catalogue so products with different margins aren’t forced to share one target (section 4).
- Targets and budgets. Set the target from break-even, then give it budget (section 5).
- New surfaces. Free listings, local inventory ads and AI surfaces, once the first four are steady (sections 8 and 9).
We don’t repeat set-up, feed basics or troubleshooting here. Those are in our getting-started guide.
What ROAS can you afford? Break-even ROAS and margin
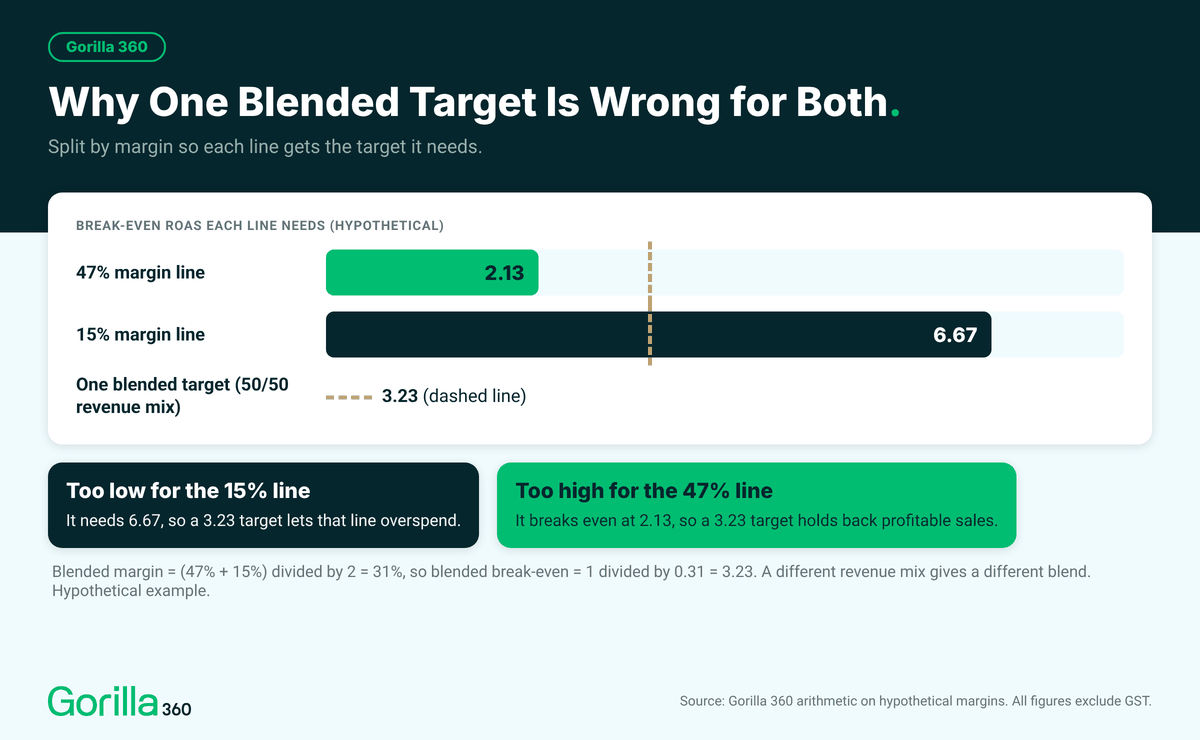
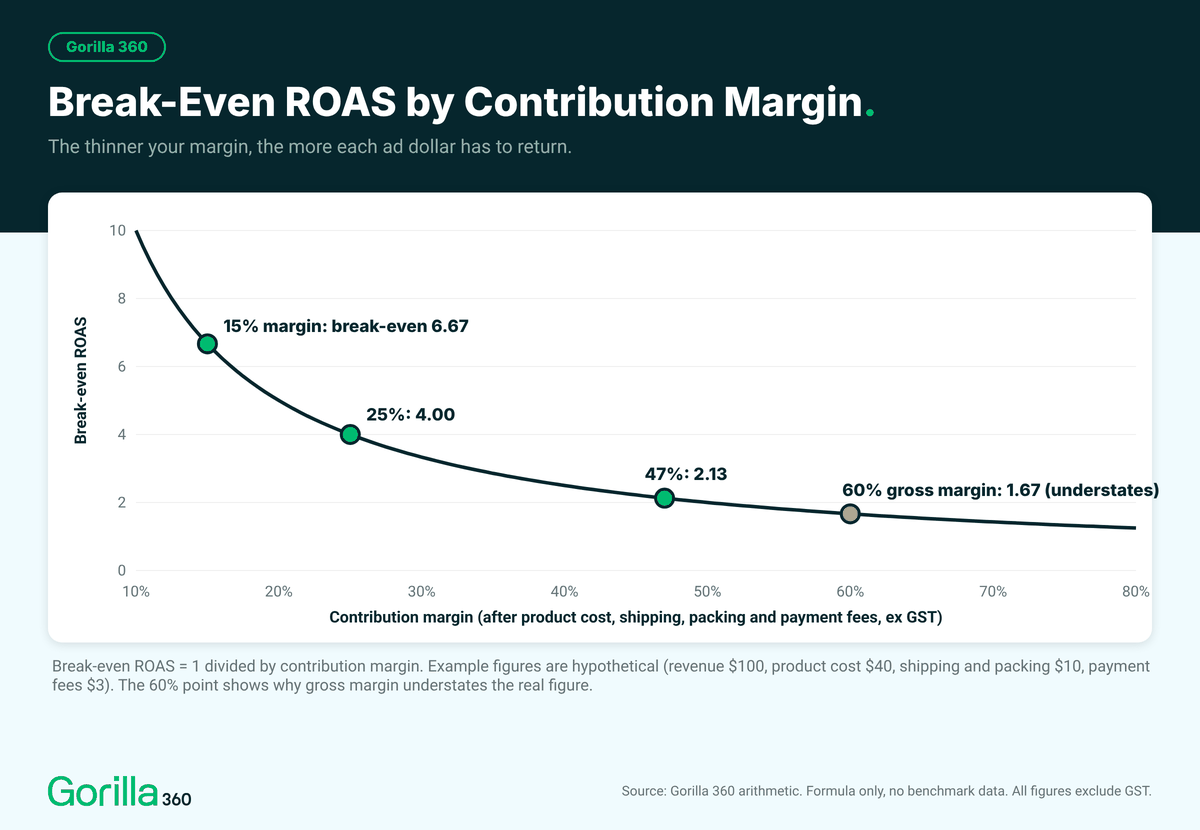
Your break-even ROAS is 1 divided by your contribution margin, using revenue without GST. If your contribution margin is 47 percent (a hypothetical example), break-even is about 2.13, so any ROAS above that makes money before overheads. Work it out for each margin tier, because one blended target will overspend on thin lines and starve strong ones.
What is ROAS, and what is break-even ROAS?
ROAS (return on ad spend) is the revenue your ads are credited with, divided by what you spent on them. A ROAS of 4.0 means $4 of revenue for every $1 of ads.
Break-even ROAS is the ROAS at which an order’s profit exactly pays for the ad that won it. Below it, each sale loses money after ads. Above it, each sale contributes something toward your overheads and profit. It is a floor, not a goal, because it ignores fixed costs such as wages, rent and software subscriptions.
Gross margin or contribution margin: which should you use?
Use contribution margin. The two are easy to mix up, and Shopify’s own education blog has treated them as the same thing, so it helps to be precise:
- Gross margin is (revenue minus product cost) divided by revenue. Shopify’s profit reports use this definition, with cost taken from the cost per item you have entered.
- Contribution margin is (revenue minus all variable costs) divided by revenue. Variable costs are the costs that rise with each extra order: product cost, shipping, packaging and fulfilment that you absorb, variable payment fees, and an allowance for returns if they are material.
Shopify’s reports don’t give you a full contribution margin on their own, so you’ll build it from a few places. A few notes on what goes in:
- Include: product cost (cost per item), merchant-paid shipping, packaging and fulfilment, variable payment fees, per-order app or channel fees, and a returns allowance when returns are material.
- Discounts: treat them as a reduction in revenue, not a second cost. If you start from Shopify’s net sales, discounts are already out. If you start from the pre-discount price, subtract them once. Don’t do both.
- Leave out: fixed monthly app subscriptions and retainers. They’re overheads, and they sit below contribution.
Using gross margin instead understates your break-even, which overstates what you can afford to spend. Here’s the effect in a hypothetical example.
Why GST matters
Keep the maths GST-exclusive, on every figure. A GST-inclusive revenue figure set against GST-exclusive costs makes your margin look better than it is. Everything in this guide, including the calculators, uses revenue without GST.
There are two practical checks, and neither is tax advice (your accountant is the right person for how GST applies to your business):
- Check the value Google receives. Compare your Google Ads conversion value for a real order with the same order in Shopify, before tax. Google documents that the Google & YouTube app’s purchase value excludes shipping and taxes, but we couldn’t confirm from an official source whether the app removes GST that is already included in a tax-inclusive Australian price, so please check one order in your own store rather than assume. A Shopify Community thread describes a store whose value began including tax, which is a single report we haven’t verified. If the value does include GST, your ROAS reads about 10 percent higher than your ex-GST ROAS, so compare it with a break-even on the same basis. Target ROAS must always be set on the same basis as the conversion value your account actually receives.
- Check your ad spend. Google Ads charges GST on advertising for accounts with an Australian business address. Whether you can claim that GST back depends on your business, so ask your accountant. If you can’t, your ad spend is effectively higher, and so is your break-even.
A hypothetical example, ex GST: an order brings in $100 ex GST ($110 including it). If you wrongly use $110 against the same costs, margin looks like 51.8% and break-even looks like 1.93, which understates the real 2.13. If Google’s conversion value includes GST ($110 per order), the matching break-even on Google’s number is 2.13 × 1.1 = 2.34.
A worked example
Here are the numbers for one order, in a hypothetical Australian store (AUD, ex GST, not benchmarks):
| Step | Formula | Example |
|---|---|---|
| Revenue per order (net of discounts) | $100 | |
| Product cost (cost per item) | $40 | |
| Gross margin | ($100 minus $40) divided by $100 | 60% |
| Shipping, packaging and fulfilment you absorb | $10 | |
| Payment and transaction fees (variable) | $3 | |
| Returns allowance | $0 in this example | |
| Contribution before ads | $100 minus $40 minus $10 minus $3 | $47 |
| Contribution margin | $47 divided by $100 | 47% |
| Break-even ROAS (contribution) | 1 divided by 0.47 | 2.13 |
| Rough break-even using gross margin only | 1 divided by 0.60 | 1.67 (understates the real figure) |
A target of 2.0 looks sensible if you only look at gross margin (break-even 1.67), but at the real 47 percent it returns $0.94 of contribution for every $1 of ads, a loss of about 6 cents per ad dollar.
Adding returns. If you want to include returns, use this: contribution before ads = R × (1 − r) − C × (1 − r × s) − S − F, where R is revenue ex GST, r is the share of order value refunded, C is product cost, s is the share of returned goods you can resell at full value, S is shipping and fulfilment you absorb (net of shipping income, ex GST) and F is payment fees. It assumes outbound shipping and fees aren’t recovered on a refund and ignores return shipping. In the example above with r = 5% and s = 100%, contribution is $44, the margin is 44% and break-even is 2.27. If none of the returned goods can be resold (s = 0), contribution is $42 and break-even is 2.38. We use the pre-refund revenue in the denominator because platform ROAS counts the value at the time of purchase.
Break-even by margin tier
Now let’s look at what happens when products earn different margins. Here are three hypothetical tiers:
| Tier (hypothetical) | Contribution margin | Break-even ROAS | Target ROAS if you want to keep 5% of revenue after ads |
|---|---|---|---|
| High margin | 47% | 2.13 | 2.38 |
| Medium margin | 25% | 4.00 | 5.00 |
| Low margin | 15% | 6.67 | 10.00 |
Now suppose half your revenue comes from the 47 percent line and half from the 15 percent line. The blended contribution margin is (0.47 + 0.15) ÷ 2 = 31 percent, so a single blended break-even is 1 ÷ 0.31 = about 3.23. That one number is wrong for both lines: it overspends on the 15 percent line (which needs 6.67) and holds back the 47 percent line (which breaks even at 2.13). The blend is by revenue, so a different mix gives a different blended number. That is the whole case for splitting by margin.
Turning break-even into a target
Break-even tells you the floor. To set a target, decide how much of each sale’s revenue you want left after ads, then use: target ROAS = 1 ÷ (contribution margin minus the share you want to keep). In the 47 percent example, keeping 10 percent of revenue after ads gives 1 ÷ (0.47 − 0.10) = 2.70 (hypothetical).
A store can choose to miss first-order break-even on purpose when repeat purchases make up the difference. That only works with your own retention data and a clear time window, because definitions of customer lifetime value vary a lot.
What is a good ROAS?
There’s no single answer, and we couldn’t find an Australian benchmark we’d trust. A good ROAS is one that clears your break-even by the margin of safety you need. Platform ROAS also isn’t the whole picture: it counts revenue at the time of purchase, so it doesn’t know about later returns, and what it does with discounts depends on the tag. For the Google & YouTube app, Google documents that the purchase value takes discounts into account. Check yours.
ROAS versus POAS, and Google’s gross profit column
POAS (profit on ad spend) has no standard definition, so here is the one we use: POAS = contribution before ads ÷ ad spend, on the same revenue basis and with ad spend before GST. That means POAS = ROAS × contribution margin, and break-even POAS is 1.0. In the example, 2.13 × 0.47 = 1.00.
Google’s cart data reporting calculates gross profit as revenue minus the cost of goods sold. That ignores shipping, fees and returns, so a “profit per ad dollar” built on Google’s gross profit column has a break-even above 1.0. In the example it is 60 ÷ 47 = 1.28, which equals 2.13 × 0.60. Don’t treat Google’s profit column as profit after all your variable costs.
Try it with your own numbers
The calculator below extends the one in our getting-started guide. Enter up to three margin tiers and it shows the break-even and target ROAS for each, the blended figure, and what a single blended target would do to each tier. Nothing is sent or stored: the sums happen in your browser.
Break-Even ROAS by Margin Tier.
Free to use. Nothing is sent or stored: the sums happen in your browser. All figures exclude GST.
Tier 1: High margin
Tier 2: Middle margin
Tier 3: Thin margin
Shared inputs
Use the same basis (ex GST) for every figure, and for the conversion value in your Google Ads account, so your targets line up with the ROAS you see there. Hypothetical example numbers are loaded by the button.
| Tier | Contribution per order | Margin | Break-even ROAS | Target ROAS | Orders a month |
|---|---|---|---|---|---|
| Enter your numbers to see each tier. | |||||
Enter your numbers to compare one blended target with a target per tier.
Where each tier sits
Break-even ROAS = 1 divided by contribution margin. Formula only, with no benchmark data.
- Contribution per order = order value minus refunds not recovered, product cost not recovered, shipping and payment fees (all ex GST)
- Break-even ROAS = order value divided by contribution per order (that is, 1 divided by margin)
- Target ROAS = 1 divided by (margin minus the share of revenue you want to keep)
- Blended margin = revenue-weighted average of tier margins. A single blended target overspends on thin tiers and holds back high tiers.
- Orders a month = ad spend multiplied by the tier’s target ROAS, divided by its order value (an estimate at target, not a forecast)
A starting point, not a forecast, and not tax or accounting advice. Conversion volume flags use Google’s published floor of 15 conversions in 30 days for Target ROAS on Search and Shopping, and a vendor reference of 150 or more conversions (a global, retail vendor figure, not a Google rule).
Download the margin tier worksheet (Excel, opens in Google Sheets too, free, no email needed)
How do you get your margin into Google Ads?
There are three routes you can set up yourself: report profit by sending cost of goods sold in your feed and conversions with cart data, bid by margin tier using custom labels and separate targets, or pass profit as the conversion value. Start with the first two and pilot the third. Google also has a profit goal in beta, which you can’t self-serve.
Break-even ROAS only helps if Google can act on it. These routes are how you get your margin into the account, from the least to the most adventurous.
Route 1: report profit with cost of goods sold and cart data
This route changes what you can see, not how Google bids. Google Ads can report gross profit when two things are in place: your conversions are sent with cart data (the list of products in each order), and your feed includes the cost_of_goods_sold attribute (what each product cost you). Google’s own example uses an approximate value of 80 percent of the price, so the figures don’t have to be exact.
What you need to know:
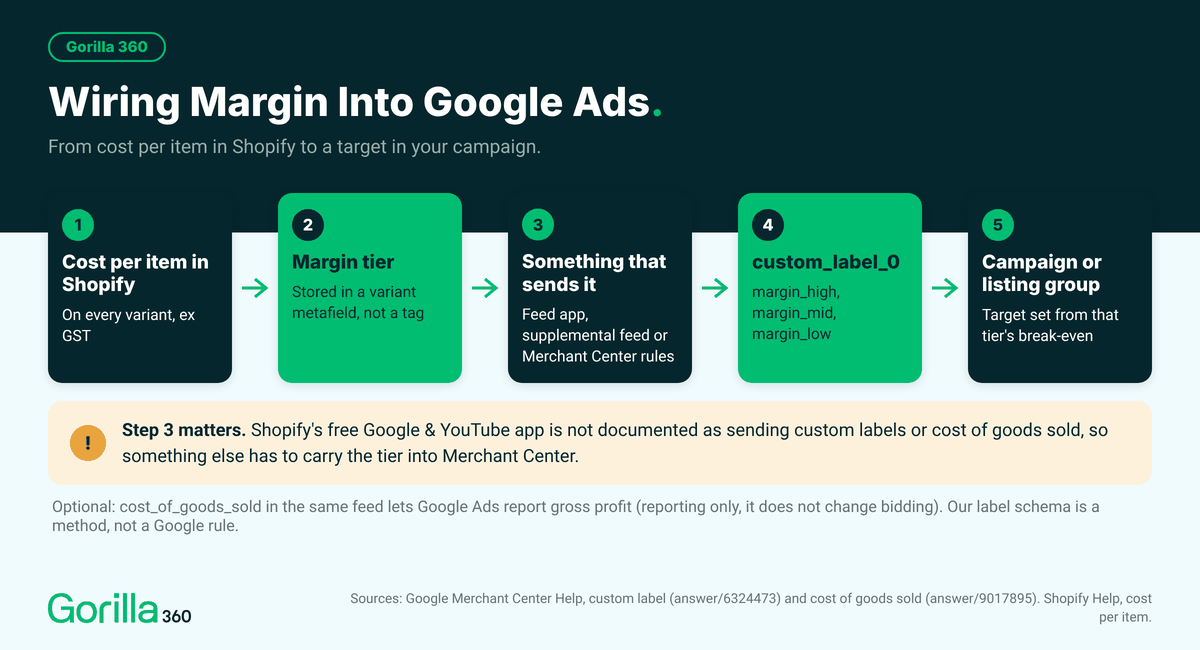
- Cost per item is our starting point. In Shopify, cost per item is the natural source for cost of goods sold, and we treat it as the working source of truth. Shopify’s and Google’s documentation we reviewed don’t show the Google & YouTube app mapping that field to the cost_of_goods_sold attribute, so plan to send it with a feed app, a supplemental feed (a second spreadsheet or file Merchant Center reads alongside your main feed) or Merchant Center rules, unless a test in your own account proves otherwise.
- Item IDs must match. The item IDs in your conversion tag must exactly match the Merchant Center id. The parameter is called items.id when Google Ads is the conversion source, and items.item_id when Google Analytics is. Conversions need to come from the Google tag or Google Tag Manager. Google flags mismatched IDs in its conversion diagnostics, so check them before you trust any profit column.
- Only items from the linked Merchant Center count. Sales of products that aren’t in the Merchant Center account linked to your Google Ads account aren’t included.
- Cart data from the Google & YouTube app is documented. Google documents that the app sends the product list (id, price and quantity) with each purchase. Whether Google Ads accepts and matches it is specific to your account, so use the diagnostics card (Goals, then Diagnostics) and place a test order. For feed app tags, including Simprosys, we couldn’t find documentation saying they send cart data in Google’s format, so ask the vendor in writing and test. We cover how in section 10.
- It’s gross profit, not contribution. As covered in section 2, Google’s profit columns use revenue minus cost of goods sold. They don’t include shipping, fees or returns.
Route 2: bid by margin tier with custom labels
This is the route that changes how Google bids. You give each product a margin tier in a custom label (one of five free-text fields, custom_label_0 to custom_label_4, that you define and Google never shows shoppers), then give each tier its own listing group or campaign and its own target, set from that tier’s break-even. Google’s own help uses a “margin” label with “low margin” and “high margin” as an example, and its retail guidance supports separate campaigns for different ROAS targets.
Here’s how we wire it up on Shopify:
- Record cost per item on every variant, excluding GST.
- Calculate a GST-exclusive margin from selling price excluding GST and that cost, and build tiers from margin, not from price bands.
- Store the tier in a metafield, not a tag. Tags don’t become Google custom labels, and a product-level tag gets messy when variants have different costs. A variant metafield is cleaner. (Variant metafields can’t be set in the product CSV, so use Shopify’s variant bulk editor.)
- Send the metafield to a custom label with a feed app, a supplemental feed or Merchant Center attribute rules. Shopify says the Google & YouTube channel doesn’t use the Google Shopping custom label metafields in its product CSV, and Google’s own page for the Shopify app only documents optional labels for age, gender and condition. The native app isn’t a documented path for margin labels.
- Review monthly and before each sale, and record every change with a date. A discount can move a product down a tier.
Shopify Flow (Shopify’s free automation app) can write a metafield after a price change. Shopify’s documentation doesn’t list cost per item among the fields that trigger a Product updated workflow, so don’t treat Flow as a complete method until you’ve tested it on your store. When cost changes, a bulk recalculation or a feed app that reads cost per item directly may be needed.
Two or three tiers are usually enough. Google’s account structure guidance explains the trade-off: each extra split gives a target that fits better and costs you some of the data that makes bidding smart. Five tiers with a handful of sales each give the bidding too little to learn from. And a note we make again in the next section: in Performance Max the target is set per campaign, not per asset group, so each tier that needs its own target needs its own campaign.
Our working label schema, which is a method and not a Google rule:
| Label | Use | Example values |
|---|---|---|
| custom_label_0 | Margin tier | margin_high, margin_mid, margin_low |
| custom_label_1 | Performance tier (optional) | review monthly |
| custom_label_2 | Season or sale status | full_price, on_sale, clearance |
Keep each label well under 1,000 distinct values, and write down your label map so anyone who changes the feed knows what each value means. Our free custom label map template is a starting point.
Route 3: profit as the conversion value
The third route sends Google a margin-adjusted value in place of revenue, so a target ROAS becomes a target for profit on ad spend. Google’s own help pages say the value you tell it to maximise can be something like “profit margins”, so this isn’t only a vendor idea. Practitioners also describe it, and they disagree on when it’s worth it.
The risks are real. Profit swings harder than revenue during promotions. Low profit targets can be hard for Smart Bidding to hold. And Google then reports profit in the revenue column, which breaks comparison with your Shopify revenue unless you document it. We found no independent test showing that profit-as-value beats margin-tier targets, and we’ve seen no evidence either way in Australia.
Our position: if your margins vary widely, your promotions are stable and you have plenty of conversions, a controlled pilot on one campaign is reasonable. Otherwise, start with cart data reporting and margin-tier targets.
What doesn’t work, and what Google doesn’t offer yet
- Conversion value rules can’t vary by product margin. Google’s value rules use conditions such as audience, location and device, not product attributes.
- Google’s profit goal is in beta. Google’s own holiday tips page (an older page that is still live) says you can “optimize to profit goals (currently in beta testing) in Performance Max and Standard Shopping campaigns”. We found no Google how-to page and no general availability announcement, and we haven’t seen the setting in an account, so we can’t tell you whether it’s available in Australia. If you’re interested, ask your Google representative, or check whether a profit goal appears in your campaign settings. We don’t promise it.
Which route first?
| Route | What it needs | What it risks | Our default |
|---|---|---|---|
| 1. Report profit | Cart data, cost_of_goods_sold in the feed, matching item IDs | Gross profit only. Mismatched IDs. Doesn’t change bidding | Start here |
| 2. Bid by margin tier | Cost per item, a margin tier in a metafield, a custom label, separate listing groups or campaigns, a target per tier | Splitting data too finely. Tiers going stale after price or cost changes | Start here too |
| 3. Profit as conversion value | A margin-adjusted value per product sent in the conversion | Volatile in promotions. Reporting no longer matches Shopify revenue. No independent evidence it beats route 2 | Pilot on one campaign |
| Google’s profit goal (beta) | A Google representative. Availability in Australia unconfirmed | Can’t self-serve | Ask, don’t plan around it |
Performance Max, Standard Shopping or both: how do you split the catalogue?
Run Performance Max for the core catalogue and add Standard Shopping only where you need tighter control, such as thin-margin lines, new launches or clearance. Google told advertisers in an email that when both could serve, normal auction rules apply and the highest Ad Rank wins, so campaign priority no longer protects Standard Shopping. Keep each product in one campaign type where you can.
If you need the basics of how the two differ, they’re in the Performance Max or Standard Shopping section of our getting-started guide. This section is about structure at volume.
How do Performance Max and Standard Shopping interact?
Ad Rank, the score Google calculates for each auction, decides which campaign serves when both could show a product. That rule comes from Google’s advertiser email as reported by Search Engine Roundtable, and Google’s help page on how Performance Max interacts with other campaigns doesn’t name Standard Shopping, so we’re flagging the source. Campaign priority still applies between Standard Shopping campaigns. And an exact-match keyword in a Search campaign beats Performance Max for the same query.
When to consolidate and when to split
Google’s guidance is to consolidate unless your goals, budgets or targets differ. Search Engine Land’s decision framework (a practitioner source) suggests deciding on five signals: brand cannibalisation, feed quality, channel-wise ROAS, account size and data volume, and category and margin structure. Of those, margin is the split we find easiest to defend, because it’s the one that changes what a sale is worth. Our rule (judgement, not data): combine two tiers in one campaign only when their break-even ROAS are close enough that one shared target wouldn’t materially overspend on one or starve the other. Otherwise split them, or leave the thin tier out of Performance Max.
Do you have enough conversions to split?
Check this before you split. Google’s formal threshold for Target ROAS on Search and Shopping is 15 conversions in 30 days at the conversion tracking level, and we found no per-campaign minimum documented. Google also doesn’t calculate a recommended target for campaigns with fewer than 7 conversions.
Practitioners set a much higher bar. Smarter Ecommerce, a vendor that sells segmentation software, reports from global retail data (an older dataset, not Australian) that Performance Max campaigns under 30 conversions a month miss their ROAS target more often than not, and that 150 or more is where target attainment gets reliable. Treat both as inputs, not rules. They don’t come from Australian data and one comes from a vendor.
Orders per month are roughly ad spend × ROAS ÷ average order value. A hypothetical example: $20,000 of spend at a ROAS of 4 and an average order of $100 is about 800 orders a month. Split that across three uneven tiers (say 60, 30 and 10 percent of orders) and the thinnest tier has about 80, already under the vendor’s 150 reference. At an average order of $150 and a ROAS of 3, the same spend gives about 400 orders, and the thinnest tier has about 40. The calculator includes this check.
A working structure (our model, not a benchmark)
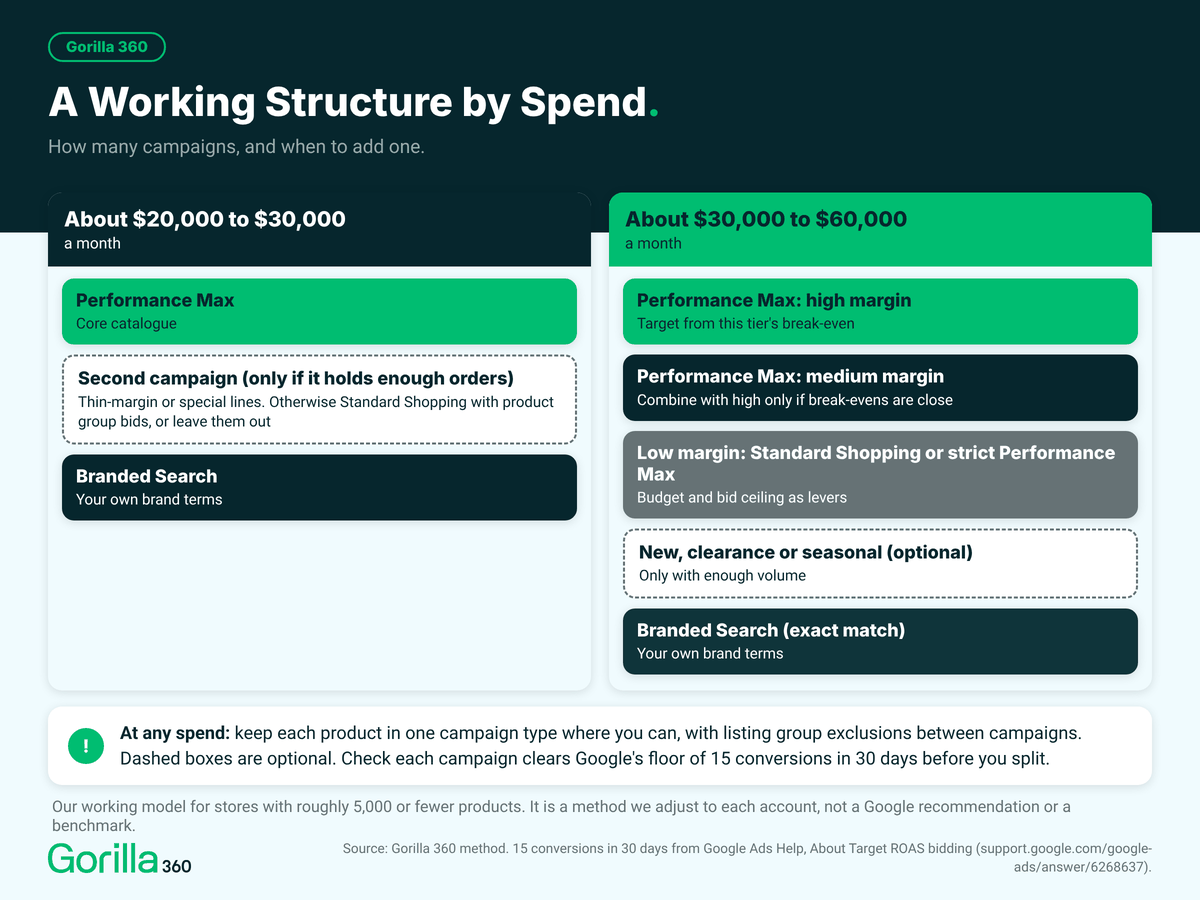
This is our working model for a store with roughly 5,000 or fewer products. It’s a method we use as a starting point and adjust to each account, not a Google recommendation.
| Monthly spend (AUD) | Working model | Condition to add a campaign |
|---|---|---|
| About $20,000 to $30,000 | Two campaigns plus branded Search: one Performance Max for the core catalogue, and a second for thin-margin or special lines only if they hold enough orders. Otherwise keep thin lines in a Standard Shopping campaign with product group bids, or leave them out. | Each campaign should clear Google’s 15 conversion floor with room to spare, and be able to aim for the practitioner reference of about 150 a month. |
| About $30,000 to $60,000 | Up to three or four: a high-margin Performance Max, a medium-margin Performance Max (combined with high only if the break-evens are close), a low-margin Standard Shopping or strict Performance Max campaign, and an optional new, clearance or seasonal campaign, plus branded Search on exact match. | As above, per campaign. Check the volume on a 30 day basis before splitting. |
| Any | Keep each product in one campaign type where you can, using listing group exclusions between campaigns. | Recommended by practitioners for cleaner reporting. Whether overlapping Performance Max campaigns for one product cause problems isn’t documented on a Google page we found. |
For the low-margin campaign, the levers are the campaign budget and, in Standard Shopping, a bid ceiling. Standard Shopping gives you product groups and manual bid options. Performance Max can’t set a manual bid on a single product, so a “spend cap” isn’t really available there. Set the target from that tier’s own break-even.
Heroes and zombies: the disagreement
Some practitioners split campaigns into “heroes” (your best performers by past ROAS) and “zombies” (products with little or no traffic). Simprosys documents a Zombie SKUs campaign builder. Smarter Ecommerce argues against rigid buckets based on past ROAS, because they can starve products of data and reward past revenue over margin, and it sells a dynamic alternative. Both are vendors, neither is Australian evidence, and neither gives test data we could read. We’d treat it as a test: run it against your main campaign and measure incrementality, not just ROAS.
Performance Max and your brand: test, don’t assume
Google says Performance Max is designed to find brand traffic, that negative keywords aren’t always needed, and that brand exclusions are available (with a checkbox to keep your Shopping ads showing on those searches). Search Engine Land recommends a dedicated branded Search campaign for most brands.
One measurement firm’s analysis (Haus, reported by PPC Land, global, from multiple customer experiments with no sample size stated) found that including brand terms drove more incremental revenue in half of its tests, that excluding them drove 24 percent more incremental revenue on average across all tests, and that excluding them lowered customer acquisition cost in every test, with the result also depending on average order value. It’s a split result from one source, so we read it as a prompt to test on your own account, not a rule.
Controls worth using
Search themes (up to 50 per asset group), search terms insights, campaign-level negative keywords for brand suitability, the channel performance report and final URL expansion controls are all documented. Channel prioritisation and budget allocation are rolling out progressively from 15 October. Budget allocation is best effort, and priority has no effect when a campaign isn’t limited by budget. They can’t be set from a manager account. We’d run them as a reversible test, not a default.
If you test Performance Max against Standard Shopping, use a Google Ads experiment for at least four weeks and judge it on profit after ad spend, not ROAS alone. Be clear on what it tells you: it compares two campaign types, it doesn’t tell you whether ads cause sales that wouldn’t otherwise have happened (we cover that in section 10).
Where Demand Gen and AI Max fit
Demand Gen with a product feed is a later-stage prospecting test, once Shopping and Performance Max are stable, with its own budget. AI Max for Shopping was announced as a closed beta, and we couldn’t confirm Australian availability, so don’t plan around it until it appears in your account. If it does, decide who approves any title rewriting, because it can rewrite titles for English feeds.
Our Google Shopping management for Shopify stores and Google Ads management pages explain how we run this for clients.
How do you set targets and budgets after the August bidding change?
Since 17 August, campaigns that run out of budget are held more consistently to their target ROAS, so the target now decides how far your budget goes. Set the target from break-even first, then add budget in steps, change one lever at a time, and give each change one to two conversion cycles before judging it.
This is the change we think matters most for a store spending $20,000 a month or more, because it makes the number you type into the target field much more literal.
What changed on 17 August, in Google’s words
Google says campaigns that are limited by budget and use a target-based strategy (Target ROAS or Target CPA) now “perform more consistently towards your bid target, including when you make budget adjustments”. Before, a budget-limited campaign could quietly beat its target because it only took the cheapest auctions. Google’s own example: with a target CPA of $10 and a recent actual CPA of $5, the campaign now delivers closer to $10.
The points that matter for your account, all from Google:
- It covers Search, Shopping, Performance Max, Demand Gen and Travel.
- Campaigns that aren’t limited by budget don’t change.
- Google will not adjust your targets or budgets for you.
- If a campaign was overperforming its target, you may see volatility if you take no action. Google’s advice to keep performance steady is to update your targets to match recent performance averages.
- Google also advises giving a budget buffer while setting a target that reflects the efficiency you want, and says that with demand-led budgeting you can set higher daily budgets but shouldn’t expect them to be spent in full.
- A campaign on Maximise conversion value with no target isn’t target-based, so the change doesn’t apply to it (this is our reading of Google’s scope). For those campaigns the budget is the lever, and ROAS will float as you change it.
- Don’t respond with data exclusions or new bid limits just because of this update. Google advises against it because it can cause performance swings.
- Google has a Bid Target Adjustment Tool to compare your historical performance with your current targets.
A small naming note: “Maximise conversion value with a target ROAS” now appears in Google Ads as “Target ROAS”. It’s a label change only, and you’ll see both names for a while.
What the early data suggests (a vendor, global, and early)
Smarter Ecommerce, a vendor, analysed aggregated ecommerce accounts, and Search Engine Land reported the results. Median cost per click for budget-limited Target ROAS campaigns rose 15.8 percent (from EUR 0.38 to EUR 0.44), while cost per click for campaigns that were never budget-limited fell 13 percent. The median overshoot of the ROAS target (how far above target campaigns were landing) went from about 20 percent before the change to roughly zero by the end of August, and about half of budget-limited campaigns now land on target, with a quarter above and a quarter below. One UK homeware account saw its cost per click rise 44 percent in a week.
It’s not Australian data and it’s early, so treat it as a sign of direction. Google calls the change “more consistent”. The vendor calls it a cliff. They agree the surplus above target went away.
Setting the order of operations
Our judgement, built on Google’s guidance, not a Google rule:
- Diagnose. Check whether the campaign is limited by budget, and compare its actual ROAS with its target.
- Set the target from break-even (section 2). Use the target your margin needs, not the one the campaign happened to deliver.
- Add a budget buffer. Keep the daily budget comfortably above your average daily spend, and don’t expect it to be spent in full.
- Wait one to two conversion cycles before judging. Google says Smart Bidding reacts to target changes in real time, and that it’s worth waiting this long to evaluate.
Change one major lever (structure, target or budget) at a time. A weekly rhythm is our own rule of thumb, so adjust it to your conversion delay.
Here’s how that plays out in the most common situations:
| Situation | First move | Then |
|---|---|---|
| Budget-limited, and ROAS is now below what you need | Raise the target to your break-even based number | Add budget only after ROAS is back at target |
| Budget-limited, and you were relying on surplus above target | Raise the target toward recent actual ROAS (Google’s “maintain current performance” advice) | Accept less volume, or add budget |
| Budget-limited, you want more volume and profit allows | Lower the target toward break-even plus your safety margin | Add a budget buffer and expect it not to be spent in full |
| Not limited by budget | No change from the update | Normal management |
| Maximise conversion value with no target | Budget is the lever | Step it up and watch marginal ROAS |
Check marginal ROAS before each budget step
Every time you raise a budget, compare what the extra spend returned with your break-even, not the account average. This small tool does the sum.
Marginal ROAS Check.
Did the extra spend pay for itself? Nothing is sent or stored.
Enter your numbers to see whether the extra spend cleared break-even.
- Marginal ROAS = extra revenue divided by extra spend
Hypothetical example numbers. Use periods of the same length, and allow for conversion delay. A starting point, not a forecast.
Planning for sales and peaks
Google’s holiday guidance says to adjust budgets and ROAS targets four to six weeks before a peak, and to use Performance Planner. Seasonality adjustments are for short, high-intent windows of 1 to 7 days (Google notes they may be less effective beyond 14 days), and only when you have your own expectation of how conversion rates will shift. For longer promotions, adjust targets by hand.
Separately, our own rule of thumb is to avoid structural changes (new campaigns, listing group changes) in the two to three weeks before a big sale. It’s judgement, not a Google rule, and it doesn’t conflict with Google’s advice about targets and budgets. Search Engine Land also advises against major changes heading into a holiday window.
For key Australian dates, use your own sales calendar, and our ecommerce marketing calendar is a good starting point.
A quick audit you can run this week
- List every Target ROAS and Target CPA campaign, and mark which are limited by budget.
- For each, put actual ROAS next to the target and next to your break-even.
- Reset targets that were set to a number from before the change.
- If you raised targets in response and the campaign isn’t limited by budget, check whether the higher target is still what you want.
- Reset any expectations (yours, your board’s or your client’s) that relied on surplus above target.
Our free scale-readiness and target audit checklist turns this into a checklist. Google also lists a conversion floor of 15 conversions in 30 days at the conversion tracking level for Target ROAS on Search and Shopping, so check each campaign meets it.
Want a second pair of eyes on your targets?
Book a free Google Ads strategy session and we’ll look at your targets, structure and tracking with you. It’s free, with no obligation.
Is your feed ready to scale?
At scale, your feed is your targeting. Titles, identifiers, product type and custom labels decide which products Google shows and how you bid on them. Keep one app writing to Merchant Center, confirm it has moved to the Merchant API, and fix image sizes before enforcement at the end of January.
We covered feed basics in the getting-started guide. Here’s what changes when you’re scaling.
Your feed is a control layer
Beyond the basics, a few attributes act like controls:
- Custom labels, as in section 3, tell your campaigns which margin tier, season or sale status a product belongs to.
- Product type (Google only uses the first value for bidding and reporting) lets you build listing groups in your own category language.
- cost_of_goods_sold powers profit reporting.
- Price, sale price and availability must match your site. A price mismatch can trigger disapprovals before you know about it.
A pattern we see: In recent Gorilla audits of Shopify stores, one of the most repeated product data findings was missing or unusable barcodes: spaces inside the number, the same barcode on two variants, and many products with none at all. (Patterns from recent audits. Details anonymised.)
One app, one country
Only one app should write product data to Merchant Center for each country. Connecting an existing Merchant Center account to the Google & YouTube app can overwrite an existing feed, so this is an operations decision, not a click. Never run two feed apps against the same country.
Merchant API: what to check
Google’s Content API for Shopping was sunset on 18 August. Google says requests without an extension have been failing intermittently since 1 September, and full shutdown is planned for early next year (subject to revision). Google also says platform partners handle the migration for you and merchants need not act. For the Google & YouTube app, Google says no action is needed. For a third-party feed app, check your Merchant Center Data sources list (a feed name showing “(Merchant API)” is one sign), and get written confirmation from the vendor.
Image sizes and other deadlines
Merchant Center image size warnings began in April, and Google will enforce the rules from the end of January. Replace undersized images before your busiest weeks, not during them.
Shipping, returns and titles
If your Shopify shipping profiles are custom, set shipping explicitly in Merchant Center, and add your return policy there too. For titles, Google’s rules are documented, but the idea that a particular title structure lifts performance is a working assumption, so test and record the results. Keep feeds free of promotional text and excess capitals. If AI Max for Shopping reaches your account, decide who approves title rewrites. Our GTIN and MPN guide covers identifiers in depth.
Structured data: feed hygiene, not an AI tactic
Your product pages carry markup (structured data) that helps Google check the price, availability, shipping and returns in your feed. Google says that supplying both on-page markup and a Merchant Center feed maximises your eligibility. It’s good hygiene. It isn’t a way to win citations in AI answers: Google says no special markup is needed to appear in AI Overviews or AI Mode, and an Ahrefs study of 1,885 pages that added markup found no clear change in AI citations.
A short checklist for a Shopify store:
- Product or ProductGroup markup. Themes that use Shopify’s structured data filter output this by default, but themes vary, so view the page source to confirm.
- Price and availability match. The markup, the page and the feed must say the same thing.
- Real GTINs. Practitioners report Shopify themes only print a GTIN when the variant’s barcode field is filled in. Fix this in your product data, and never use made-up or internal codes.
- Shipping and returns. Set shipping in Merchant Center (required in Australia for free listings), and add your return policy on your site and in Merchant Center. Practitioner checks conflict on whether some themes output return policy markup, so check what yours outputs.
- Reviews. Only mark up real reviews that are visible on the page.
- One Product entity per page. Apps that inject their own product markup can create duplicates, so check before adding more.
- Test. Use Google’s Rich Results Test and the Merchant listings report in Search Console. Google doesn’t guarantee features that use markup will appear.
Where does a feed app like Simprosys fit?
A feed app can earn its place when you need margin labels driven by Shopify data, extra channels, or catalogue-wide rules. Simprosys is one option: its public price starts at AUD 7.33 a month, and we list below what we couldn’t confirm. For a simple catalogue, Shopify’s free Google & YouTube app plus Merchant Center rules is usually enough, in our experience.
Our disclosure: We use Simprosys on client accounts. We have no paid or affiliate arrangement with Simprosys. We include it because its public documentation covers custom labels, cost of goods sold and multi-market feeds, and we have listed what we have not been able to confirm.
What a feed app adds at scale
Beyond what Shopify’s free app does, a feed app typically adds rule-driven attributes, bulk editing, extra channels and sometimes more control over multiple markets. Simprosys’s public pages list automated feed rules, bulk edit, metafield mapping, custom labels, feeds by Shopify Markets (country, currency and language), several channels, cost of goods sold submission, tracking tags and a Performance Max campaign builder. Those are vendor and app listing claims. It also recommends using one feed solution at a time, which matches our advice.
For this guide’s method, here’s where it fits. You keep the margin tier in Shopify (a metafield, built from cost per item), and the feed app maps it to custom_label_0 with a rule. This is a design pattern, not a one-click feature, and which rule conditions the Shopify app supports is something we haven’t verified. A feed app is one practical way to do it. Merchant Center attribute rules or a supplemental feed also work and don’t need another app.
Where Simprosys fits for margin-driven labels
Price and ratings first, in plain numbers (Shopify App Store, checked 14 November):
- Price: from AUD 7.33 a month (up to 500 products), AUD 13.21 (up to 1,000), AUD 20.55 (up to 5,000) and AUD 26.43 (up to 10,000), with a 21 day free trial. The AUD amounts are Shopify’s estimates, converted from USD. Against $20,000 of monthly spend, the top listed base tier is about 0.13 percent and the up to 5,000 product tier about 0.10 percent (arithmetic, base plans only). Add-ons cost extra, such as AI feed optimisation at AUD 1.00 per 25 products (one-time), an XML feed and extra Markets feeds. Pricing above 10,000 products isn’t shown, so check before quoting for a larger catalogue.
- Rating: 4.9 from 4,965 reviews, 97 percent five-star, with 68 reviews at one or two stars (about 1.4 percent). Reviews often praise support and migration help. For comparison, the free Google & YouTube app shows 4.5 from 5,609 reviews. Ratings are self-selected, so we don’t rank on them.
What we have not been able to confirm
- Merchant API. For the Google & YouTube app, Google confirms no action is needed. For Simprosys, the vendor page we read still described its sync as using the Content API, and the only signs of migration we found are practitioner posts on LinkedIn. We couldn’t confirm it from Simprosys documentation. Given Google’s timetable above, ask Simprosys for written confirmation.
- Tracking. The Google & YouTube app is documented as sending the product list with each purchase. For Simprosys we found no documentation that its Google Ads tag sends cart data in the format Google needs, or which ID format it uses. Ask in writing and test with an order. Some reviews also report conversion events not firing, or duplicate conversions when run alongside other apps. In the one to three star reviews we read (the first page of each filter only), three describe the feed size doubling or many listing issues soon after install, and one reports a USD 203.97 charge. These are individual claims we haven’t verified, so the real count may be higher or lower.
- Margin labels. Simprosys’s help pages we found, mostly video summaries, cover custom labels and cost of goods sold but don’t show rule conditions or margin tiers.
- Local inventory. It’s listed on the app, but the only detailed set-up article we found is for its separate API product, so how it maps store codes in Australia is unconfirmed.
- Two AI systems. If you use Simprosys’s AI feed optimisation and Google’s AI Max title rewriting together, two AI systems are touching your titles. Decide who approves what.
When the free app is enough
If your catalogue is small, your labels can be set with Merchant Center attribute rules, or you already use another feed tool well, you probably don’t need another app. Don’t run two.
Switching safely
If you do switch, keep the old app connected until the new feed validates, use one app per country, keep the same product ID format so your history is kept, remove duplicate conversion tags, and reconcile Shopify orders against Google Ads conversions weekly for a month. Our free feed app switch checklist covers these steps.
Compare, don’t rank
| Option | Public price | What it’s for | Our caution |
|---|---|---|---|
| Google & YouTube app (Shopify) | Free to install (Shopify says additional charges may apply). 4.5 from 5,609 reviews | Syncing products and tracking with Google’s documented support | Not documented as sending custom labels or cost_of_goods_sold. Syncing Shopify Markets has caveats (performance history can reset for standalone country data sources) |
| Simprosys | From AUD 7.33 a month (up to 500 products). 4.9 from 4,965 reviews | Rules, custom labels, multi-market and multi-channel feeds | See “what we have not been able to confirm” above |
| DataFeedWatch | USD 64, 84 and 239 a month for 1,000, 5,000 and 30,000 product plans (USD list prices) | Rule-based feed management | USD pricing. 4.7 from 342 reviews on Shopify |
| Channable | AUD estimates from 130.75 a month (Core Plus, up to 5,000 items and 3 channels) | Multi-channel feed management | 3.8 from 37 reviews on Shopify |
No independent head-to-head test of these tools exists that we could find, so we don’t name a winner. Pick on fit. Our Shopify agency team can help you choose.
Do free listings and organic Shopping still matter when you run ads?
Yes. Free listings use the same product data as your ads and can show on Google Search, the Shopping tab, Google Images and Lens at no cost per click. They are not guaranteed to show, so treat them as a free bonus, not a plan, and make sure your ads and listings never disagree.
The basics are in the getting-started guide. Here’s what matters once you’re spending.
What free listings are, and where they show in Australia
Free listings are unpaid product listings built from your Merchant Center data. Google’s help for the Google & YouTube app lists Australia as a supported country, and Google requires shipping settings (or the shipping attribute) in Australia. A return policy is recommended, in Merchant Center and on your site. Appearance is never guaranteed.
One thing may confuse you: some Shopify Help pages, and Google’s Shopify sync page, still describe Shopping tab free listings as a United States eligibility. Confirm the free listings destination in Merchant Center rather than relying on that wording. If your Merchant Center account was created outside Shopify, also check the data source is opted in.
Keep free and paid in sync
Free listings and paid ads draw on one feed, so feed quality compounds: a clean feed helps both. The same applies to markup on your product pages (section 6). Make sure price, availability and shipping never disagree between your ads, your listings and your product pages.
Also make sure you don’t block Google’s Storebot-Google crawler by accident. Its robots.txt rules affect all Google Shopping surfaces, and security apps and bot rules sometimes block it.
What we can’t tell you
No source we found quantifies how much free traffic a Shopify store typically gets, and we found no Australian data on whether paid Shopping reduces free listing clicks. So we’d suggest using Merchant Center and Search Console reporting to see your own free listing clicks, and running an experiment before you cut paid coverage on products that already do well organically.
Free listings and AI surfaces
Merchant Center now has an AI performance report for Australian accounts. It shows how often your products appear for conversational shopping questions in AI Mode and AI Overviews, compared with a competitor set that Google chooses and you can’t change. It covers English queries and organic listings only, so it won’t show your ad results. Share of voice shows 0 if you don’t have enough impressions, and the data lags by a few days.
Google’s advice for both organic and paid AI surfaces points back to the same basics: a complete, accurate feed with matching landing pages, good images, ratings, shipping and returns. Google doesn’t publish how much feed changes affect appearance in AI Mode, so test and measure rather than assume. Where Google suggests adding top terms to titles and descriptions, only do it where the terms are true and natural for the product.
A weekly check
Once a week, look at your Merchant Center product issues, check that a few top products show the same price and stock on the site as in the feed, and note any change in free listing clicks.
Are local inventory ads worth it for a Shopify store?
Only if you have physical shops that hold stock. Local inventory ads and free local listings show nearby shoppers what is on the shelf, and both are available in Australia. Online-only stores should skip them. For stores with shops, the work is mostly accurate stock data and a verified Google Business Profile.
Is it for you?
It’s for stores with physical retail locations in Australia, a verified and linked Google Business Profile, Shopify POS with inventory tracking on, quantities maintained at each location, and products available to the Point of Sale channel. Google also requires that customers can visit, view and buy in store. Membership-only stores aren’t eligible unless non-members can also buy.
Shopify doesn’t document a plan tier or a POS Lite versus POS Pro requirement for this feature, only Shopify POS, a retail location, location-level stock and enough products.
What Shopify and Google need
- Products: more than 10 approved products. Shopify’s page says “at least 10” and Google’s page for the app says “more than 10”, so plan for 11 or more. Google reviews new products in 3 to 5 business days, according to Shopify.
- Google Business Profile: verified and linked to Merchant Center, with an address that exactly matches your website and your Shopify location.
- Local inventory data: each local product needs an id, a store code, a price and an availability (quantity is also commonly required). Store codes are case-sensitive and must match your Business Profile and the codes used in Shopify. Every product in your primary feed should appear at least once in the local data.
- Timing: Google says Shopify changes can take up to 6 hours to reach Merchant Center, and to allow 24 to 48 hours for local inventory updates more generally.
- Shopify pickup in store is a separate checkout setting, not a substitute for local inventory ads.
The 31 August change in Shopping campaigns
Since 31 August, local inventory ads run by default in Shopping campaigns, and the enable_local field no longer has an effect there. A Standard Shopping campaign for a store with shops may now start serving local offers with no change from you, so spend and reporting can mix online and local. If you need separate budgets, filter by channel (online versus local) in your listing groups. Performance Max and Demand Gen still use their own settings, and Google’s page for the Shopify app describes running local inventory ads through Performance Max.
Free local listings first
Do the free local listings and clean local inventory first, and then add paid local inventory ads. It’s a Merchant Center and Google Business Profile project, not just a feed task.
The failure points we’d check first
These are ranked by our judgement of how likely they are for a store with one to five shops, with the documented requirement alongside:
| # | Failure point | What to check |
|---|---|---|
| 1 | Business Profile not verified, or its address doesn’t match your Shopify location | Each shop needs its own matching, verified profile, linked to Merchant Center |
| 2 | POS stock not maintained | Products with only out-of-stock inventory aren’t eligible (unless your account has “pick up later” approval). Stale counts also risk disapprovals or a “Limited” status |
| 3 | Too few approved products | 11 or more approved, and fix main feed disapprovals first |
| 4 | Not on Shopify POS (for example a third-party till) | Shopify lists POS as a requirement |
| 5 | Local add-on on for an online-only business or the wrong country | The common error is “No physical stores found in countries of sale”. Online-only stores should switch local destinations off and disconnect the Business Profile from the Google & YouTube app |
| 6 | Two apps writing feeds, or a feed app with local inventory | With the Google & YouTube app, local sync is built in. For Simprosys, how store codes are mapped in Australia is unconfirmed. One feed owner per country |
| 7 | Timing | Allow 6 hours for Shopify changes and 24 to 48 hours for local inventory updates, so don’t start days before a sale |
| 8 | Price or availability disagreeing between local and online data | Local price is optional and overrides the primary feed price for that store. Set it only on purpose |
| 9 | The 31 August default | A Standard Shopping campaign may now serve local offers. Filter by channel if budgets must be separate |
What the evidence does and doesn’t say
Google claims a 21 percent increase in store visits and a 9 percent increase in online conversions for products available in store. That’s Google’s own global claim, with no method published, and we haven’t seen Australian evidence, so read it as Google’s claim, not a forecast.
We couldn’t confirm: how Shopify supplies store-level inventory and store codes for Australian merchants from end to end (Google’s page for the Shopify app says inventory syncs when addresses match, but doesn’t describe store codes or name Australia), whether store visit measurement is available in Australia, whether “pick up later” approval is available, and what set-up costs or takes. Also, local delivery and in-store pickup aren’t supported in Shopify’s Google AI Mode and Gemini direct checkout, so don’t assume they work there.
How do you measure growth you can trust?
Scaling on numbers you cannot trust is expensive. Make sure every purchase is counted once, send Google the order data it needs, set up consent properly, and check Google Ads against Shopify every week. Then judge changes by profit and, where you can, by a controlled test, not by platform ROAS alone.
The basics of tracking are in the getting-started guide. This section is for a store about to spend more. If you’d like help with the technical side, see our Google Analytics and tracking support.
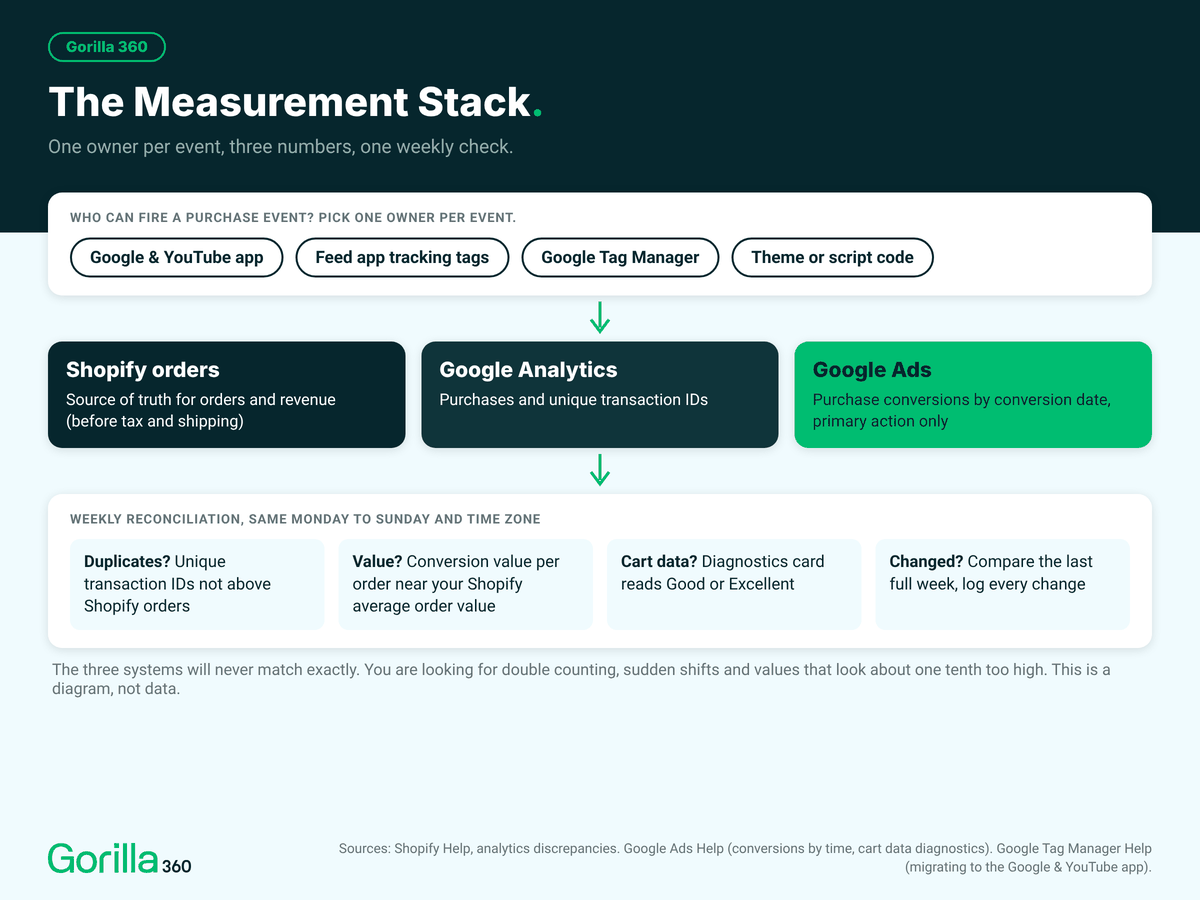
One owner per event
Pick one owner for each event on each platform: the Google & YouTube app, your feed app’s tracking tags, or a custom setup. Not two. If you switch owner, set the new Google Ads conversion as primary, then remove the old tag.
The realistic duplicate pairs are: the Google & YouTube app plus Simprosys tracking tags, either app plus a Google Tag Manager (GTM) custom pixel, and either app plus old theme or script code. Simprosys itself says to add its tracking tags only if you haven’t set them up another way, and that double tagging skews data. Google’s Tag Manager help says the new Shopify checkout limits third-party tag managers like GTM, recommends the Google & YouTube app, and says running Google tags inside Shopify custom pixels isn’t supported. Shopify calls custom pixels an advanced feature it doesn’t support. Some practitioners who teach or sell tagging favour GTM and server-side builds, while Google and Shopify steer stock stores to the app, so this is a genuine disagreement.
Shopify’s deadline to move the Thank you and Order status pages to the new version has passed. Purchase tracking that lived in additional scripts or script tags needs to be rebuilt as an app pixel or a custom pixel, so check that your purchases are still being counted.
Send the order data Google needs
Cart data tells Google Ads which products were in each order, so it can report gross profit. The Google & YouTube app sends the product list with each purchase. Your item IDs must match your Merchant Center feed exactly, so check the Goals diagnostics card and place a test order. If you use your feed app’s own tracking tags, ask the vendor in writing whether they send cart data and in which ID format. We haven’t seen documentation that says they do.
Enhanced conversions send hashed first-party data (such as an email address, with the details scrambled) to help Google recover conversions that cookies miss. The Google & YouTube app can switch this on during set-up, or later in its Google Ads settings. Conversions imported from Google Analytics aren’t supported for enhanced conversions, so use a Google Ads conversion action with the Google tag. Impact appears about 30 days after a correct set-up, and the status can show “Needs attention” until user data flows.
Consent Mode: what it does and doesn’t do
Consent Mode (version 2) passes your visitors’ consent choices to Google through four signals: ad_storage, ad_user_data, ad_personalization and analytics_storage. It needs a consent banner behind it. Shopify switches its own banner on automatically for visitors in the UK and the European Economic Area, not for Australia, so check what your store does. Google says that with the Google & YouTube app, consent mode works automatically once Shopify’s banner or a compatible consent platform is on.
Google can only model the conversions it can’t see once you pass a click threshold (700 ad clicks over 7 days per country and domain grouping, according to Google), and many smaller stores won’t. Don’t promise yourself recovered conversions. If you use Simprosys’s consent mode toggle, note it has no banner of its own, and that two consent set-ups on one store is a risk to check. This isn’t legal advice, so check your privacy obligations with your lawyer.
AI Mode ads, and direct checkout
These are two different things.
- Ads in AI Mode. On 28 October, Google announced it is scaling ads in AI Mode in Australia. Google’s help page lists Australia among the countries where ads can appear within AI Overviews and AI Mode, in English. Existing Search, Shopping and Performance Max campaigns are eligible automatically, so there’s no new campaign or separate budget, and you can’t target AI Mode on its own or opt out of it separately from Google Search. Ads are labelled Sponsored. Google includes the results in aggregate in your standard campaign and search terms reports and describes no separate AI Mode report, so you can’t judge AI Mode on its own. Whether your ads appear depends on the auction and the query, so we can’t promise volume, placement or results, and we haven’t seen Australian performance data.
- Shopify’s direct checkout in Google AI Mode and Gemini. Shopify says this is rolling out gradually to eligible stores selling to Australia, Canada or the United States, and eligible stores can switch it off. In direct checkout, Google Analytics and custom pixels don’t fire, and some products and checkout features aren’t supported (bundles, subscription-only products, customisable products, local delivery and in-store pickup), so don’t expect these orders to appear in your usual reports. How they show in Google Ads reporting isn’t something we could confirm. Google’s own checkout programme is separate, and is for select merchants. Check Shopify before you plan around any of it.
Why your numbers never match
Shopify, Google Analytics and Google Ads will never match exactly, by design. Google Ads dates a conversion on the day of the ad click by default, while “by conversion time” columns date it on the day of the sale. Google Ads only counts conversions attributed to an ad. Shopify names time zones, page reloads, bots and blockers as causes of difference too. Shopify’s order record is the source of truth for orders and revenue. Google Ads and Google Analytics show what they could attribute.
A pattern we see: In recent Gorilla audits of Shopify stores, the ad platforms between them claimed close to, or more than, all of the store’s online sales, and some tracking tags didn’t agree with Shopify’s own order count. That’s why we start with a weekly check. (Patterns from recent audits. Details anonymised.)
A weekly reconciliation
Once a week, compare three numbers for the same Monday to Sunday: Shopify orders and sales before tax and shipping, Google Analytics purchases, and Google Ads purchase conversions by conversion date. They will never match exactly. What you’re looking for is double counting, a sudden change after you edited something, and an order value that looks about ten percent too high. Keep a log so you can see the gap move.
Use the same dates and the same time zone in all three, and note each tool’s time zone. Once the sheet exists, it should take roughly 20 to 30 minutes (our estimate).
| Step | Where | What to pull |
|---|---|---|
| 1 | Shopify Analytics, Reports, Sales over time | Orders, gross sales, discounts, sales reversals, net sales. Work out gross sales minus discounts, and average order value |
| 2 | Google Analytics ecommerce purchases (or an exploration by transaction ID) | Purchases, unique transaction IDs, purchase revenue |
| 3 | Google Ads, the purchase conversion action only | Conversions and conversion value by conversion time, plus cost. Filter to the primary purchase action |
| 4 | Your sheet | The logic checks below, with a “changes made” column |
| 5 | Spot check | Pick five Shopify order numbers and confirm each appears once in Google Analytics |
The logic checks:
- Google Ads purchases (by conversion time, primary action) shouldn’t exceed Shopify orders for the same window. Google Ads only counts ad-attributed orders. Note whether consent modelling is on, because modelled conversions are included.
- Google Analytics unique transaction IDs shouldn’t exceed Shopify orders, and purchase events should be close to unique IDs. A big gap suggests duplication.
- Google Ads conversion value divided by conversions should sit in the same range as your Shopify average order value (gross sales minus discounts, over orders). If it sits roughly one tenth above for several weeks, suspect GST is in the value sent to Google. The “one tenth” is just the 10 percent GST rate, and a different product mix can also move it, so treat it as a flag, not proof.
- Track Google Ads revenue as a share of Shopify revenue as context, not as an accuracy score.
- The cart data diagnostics card should read Good or Excellent, not Needs attention.
- Compare the last full week, not the current one, because recent days keep filling in as late conversions arrive.
We don’t give a percentage for how far the systems may differ, because we couldn’t find a well-sourced one. For the first four weeks, record the gaps as your baseline, then investigate when the gap moves materially from its own baseline or a logic check fails. If a check fails, don’t change bids or targets that week.
Judge by profit and tests
Platform numbers count what ads were credited with, not what ads caused. Google’s own lift studies have eligibility rules and need a Google representative, so ask what your account qualifies for. Google lists minimums for user-based lift tests (for example 1,000 observed conversions and a minimum campaign budget of USD 5,000), and geo-based tests depend on a feasibility check with no fixed minimum stated. Both go through a Google representative, and Google says results between 50 and 90 percent certainty are only directional.
If your account doesn’t qualify, run a simple test you can defend: split brand from non-brand, change one budget on a set date, or hold out a region, and judge it on Shopify revenue and profit. Australia has only eight states and territories of widely different sizes, so geo holdouts are weak unless an analyst designs them carefully. A test also has a cost, because you withhold ads from some of the audience. Treat the result as a guide, not proof. To turn incremental revenue into profit, multiply it by your contribution margin and subtract the ad spend.
Vendor benchmarks for the mix of channels are global, not Australian, so we use them only as a prompt.
What is a sensible order for scaling over the next 90 days?
Start with measurement and margin data, then structure, then targets and budgets, then new surfaces. Change one major lever at a time, record every change with a date, and avoid structural changes in the weeks before a big sale. Judge each step on profit, not on ROAS alone.
This is our method, not evidence and not a promise. Adjust it for your own sale calendar and conversion volume.
Weeks 1 to 2: get your numbers right
Reconcile tracking and remove duplicate tags. Confirm there is one feed owner and check the Merchant API status. Load cost per item on every variant and cost_of_goods_sold in the feed, and check your item IDs match.
Weeks 3 to 4: build margin tiers
Build margin tiers and custom labels, work out break-even by tier with the calculator, and document your label map.
Weeks 5 to 6: restructure in phases
Restructure in phases (not just before a sale). Set targets from break-even, then add a budget buffer in steps.
Weeks 7 to 10: run one experiment
Run one experiment, such as Standard Shopping versus Performance Max on a defined set, or a profit-as-value pilot, and judge it on profit after ad spend.
Weeks 11 to 12: add new surfaces
Add local inventory ads if you have shops, review free listings and the AI performance insights, and decide whether Demand Gen is worth a test.
What to track
Track profit after ad spend by tier, marginal ROAS, the share of campaigns limited by budget, and impression share lost to rank and to budget. We don’t give target numbers for these, because we’d be inventing them.
Your next step
Complete the short form on our strategy session page, and one of our Google Ads specialists will analyse your account and map out what’s working and what’s not. It’s free, with no obligation.
Scaling Google Shopping FAQ
What is a good ROAS for Google Shopping?
There’s no single number. A good ROAS is above your break-even by the safety margin you need, and we found no Australian benchmark we’d trust. Work out your break-even for each margin tier with our calculator, then set targets from that.
How do I calculate break-even ROAS?
Divide 1 by your contribution margin, using revenue without GST. If your contribution margin is 47 percent (a hypothetical example), break-even ROAS is 1 ÷ 0.47, or about 2.13. At that ROAS your ads only cover their cost, so aim above it. See section 2 for the worked example.
Should I use Target ROAS or Maximise conversion value?
Use a target once you know your break-even and the campaign meets Google’s floor of 15 conversions in 30 days for Target ROAS on Search and Shopping. Without a target, budget is the lever and ROAS floats. Target ROAS is also the new label for Maximise conversion value with a target ROAS. See section 5.
Can Google bid on profit instead of revenue?
Google supports profit reporting (cart data plus cost of goods sold) for everyone. Product margin can’t be set in conversion value rules. Google’s own help page lists a profit goal as beta, and we can’t confirm availability in Australia. You can also pilot profit as the conversion value yourself. See section 3.
Should I run Performance Max and Standard Shopping together?
Yes, if there is a reason, such as control, thin margins or product launches. When both could serve a product, the highest Ad Rank wins, so keep each product in one campaign type where you can, and use listing group exclusions between them. See section 4 for how we split the catalogue.
How many campaigns should I run at $20,000 a month?
Google’s guidance is to consolidate unless goals differ. Our working model at this spend is two campaigns plus branded Search, split by margin only if each can hold enough orders. It’s a method, not a benchmark, so check your conversion volume first.
Why did my results change after August?
Budget-limited campaigns that use a target are now held more consistently to that target, so campaigns that used to beat their target may deliver less. Review your targets against break-even. Vendor data suggests the surplus above target disappeared within about three weeks. See section 5.
Should I exclude my brand from Performance Max?
Test it. Brand exclusions exist, with an option to keep Shopping ads on those searches, and a dedicated branded Search campaign is a common companion. The evidence we found is global and mixed, so test on your own account and judge it on Shopify revenue and profit, not platform ROAS alone.
Do I need local inventory ads?
Only if you have physical shops that hold stock, a verified Google Business Profile and accurate stock data. Online-only stores should skip them. Local inventory ads need 11 or more approved products and a matching address. See section 9 for the requirements and the failure points we would check first.
Do free listings still matter if I run ads?
Yes. Free listings use the same product data as your ads and cost nothing per click, but Google does not guarantee they will show. Keep your feed accurate so your ads and listings agree, and check your own free listing clicks before cutting paid coverage. See section 8.
Is Simprosys better than the Google & YouTube app?
They do different jobs. Simprosys adds rules, markets and channels from about AUD 7 a month, while Shopify’s free app is usually enough for a simple catalogue. Never run both against the same country. We use Simprosys on client accounts and have no paid or affiliate arrangement with it. See section 7.
Can my Shopping ads show in AI Mode in Australia?
They can. Google’s help page lists Australia among the countries where ads can appear within AI Overviews and AI Mode, and says existing Search, Shopping and Performance Max campaigns are eligible automatically. Ads are labelled Sponsored and results are reported in aggregate. Whether yours appear depends on the auction, so we can’t promise volume.
Want a hand scaling Google Shopping?
We manage Google Shopping for Shopify stores, from the feed through to tracking and reporting. Book a free Google Ads strategy session, or see how we work.
Book a free Google Ads strategy session See how we manage Google Shopping for Shopify stores
Sources and when this guide was last checked
Last checked: 14 November 2026. This topic changes often, so we re-check Google’s pages monthly and update the recent changes box and this line whenever something changes. Source types are shown in brackets. Where a figure comes from a vendor, a practitioner or one agency’s data, we say so in the text.
What we could not confirm (so we don’t claim it)
- Whether Google’s profit goal (beta) is available to Australian accounts.
- Whether the Google & YouTube app removes GST that is already included in a tax-inclusive Australian price, and whether it adjusts conversion value for later refunds.
- Whether Simprosys’s Google Ads tag sends cart data in Google’s format, which ID format it uses, whether it has fully moved to the Merchant API, and how its local inventory feature maps store codes in Australia.
- Whether the Google & YouTube app maps cost per item to cost_of_goods_sold or custom labels in a live account (the documentation says no, or is silent).
- Whether Shopify Flow can read cost per item or start when it changes.
- How many Australian advertisers see ads in AI Mode, any Australian performance data for them, and whether follow-up question ads run in Australia.
- Australian availability of AI Max for Shopping, and store visit measurement and “pick up later” approval for local inventory ads.
- Any Australian benchmark for Shopping cost per click, conversion rate or ROAS.
Google and Shopify sources
- Google Ads Help, changes to target-based bid strategies (17 Aug 2026): https://support.google.com/google-ads/answer/17061251
- Google Ads Help, FAQ about changes to target-based bid strategies: https://support.google.com/google-ads/answer/17125145
- Google Ads Help, fix “Limited by budget” (includes the Bid Target Adjustment Tool): https://support.google.com/google-ads/answer/2616012?hl=en
- Google Ads Help, about Target ROAS bidding: https://support.google.com/google-ads/answer/6268637?hl=en
- Google Ads Help, maximize conversion value: https://support.google.com/google-ads/answer/7684216?hl=en
- Google Ads Help, conversion value best practices: https://support.google.com/google-ads/answer/14791574?hl=en
- Google Ads Help, about conversion value rules: https://support.google.com/google-ads/answer/10518330?hl=en
- Google Ads Help, holiday tips, including the profit goal beta mention (27 Aug 2024, read 14 Nov 2026): https://support.google.com/google-ads/answer/15302774
- Google Ads Help, about conversions with basket (cart) data: https://support.google.com/google-ads/answer/9028254?hl=en-AU
- Google Ads Help, cart data parameters: https://support.google.com/google-ads/answer/14943675?hl=en
- Google Ads Help, provide cost of goods sold: https://support.google.com/google-ads/answer/14943482?hl=en
- Google Ads Help, metrics available with cart data: https://support.google.com/google-ads/answer/16564103?hl=en
- Google Ads Help, cart data diagnostics: https://support.google.com/google-ads/answer/16300258?hl=en
- Google Ads Help, retailer best practices for Performance Max: https://support.google.com/google-ads/answer/11546049?hl=en
- Google Ads Help, how Performance Max works with other campaigns: https://support.google.com/google-ads/answer/13810170?hl=en-AU
- Google Ads Help, campaign priority for Standard Shopping: https://support.google.com/google-ads/answer/6275296?hl=en
- Google Ads Help, channel prioritisation and budget allocation: https://support.google.com/google-ads/answer/18385152?hl=en
- Google Ads Help, brand exclusions: https://support.google.com/google-ads/answer/14505308?hl=en
- Google Ads Help, seasonality adjustments: https://support.google.com/google-ads/answer/10369906?hl=en
- Google Ads Help, ads in AI Overviews and AI Mode: https://support.google.com/google-ads/answer/16297775?hl=en
- Google Ads & Commerce Blog, ads in AI Mode expand to new markets (28 Oct 2026): https://blog.google/products/ads-commerce/ads-in-ai-mode-global/
- Google Ads Help, Taxes in your country (Australia): https://support.google.com/google-ads/answer/2375370?hl=en-AU
- Google Ads Help, about consent mode modeling: https://support.google.com/google-ads/answer/10548233
- Google Ads Help, understand conversions by time: https://support.google.com/google-ads/answer/9549009
- Google Ads Help, set up Conversion Lift based on users: https://support.google.com/google-ads/answer/12005564?hl=en
- Google Ads Help, set up Conversion Lift based on geography: https://support.google.com/google-ads/answer/14097193?hl=en
- Google Ads Help, about Performance Max experiments: https://support.google.com/google-ads/answer/12997711?hl=en
- Google Merchant Center Help, custom label: https://support.google.com/merchants/answer/6324473?hl=en
- Google Merchant Center Help, cost of goods sold attribute: https://support.google.com/merchants/answer/9017895?hl=en
- Google Merchant Center Help, syncing products from the Google & YouTube app: https://support.google.com/merchants/answer/13693394?hl=en
- Google Merchant Center Help, conversion tracking with the Google & YouTube app: https://support.google.com/merchants/answer/13494537?hl=en
- Google Merchant Center Help, show your products for free on Google: https://support.google.com/merchants/answer/13692890?hl=en
- Google Merchant Center Help, free listings for products: https://support.google.com/merchants/answer/13889434?hl=en
- Google Merchant Center Help, about AI performance insights: https://support.google.com/merchants/answer/17200695?hl=en
- Google Merchant Center Help, set up local inventory in the Google & YouTube app: https://support.google.com/merchants/answer/13709335
- Google Merchant Center Help, local inventory ads and free local listings: https://support.google.com/merchants/answer/3057972?hl=en
- Google Merchant Center Help, local inventory data specification: https://support.google.com/merchants/answer/14819809?hl=en
- Google Merchant Center Help, eligible local products: https://support.google.com/merchants/answer/7371577?hl=en
- Google Merchant Center Help, local inventory policies: https://support.google.com/merchants/answer/3271956?hl=en
- Google Merchant Center Help, “No physical stores found in countries of sale”: https://support.google.com/merchants/answer/15071674?hl=en
- Google Merchant Center Help, product data specification update (image size enforcement, read 14 Nov 2026): https://support.google.com/merchants/answer/16989427?hl=en
- Google Merchant Center Help, Google checkout (UCP) for select merchants: https://support.google.com/merchants/answer/16837055?hl=en
- Google Tag Manager Help, FAQ about migrating to the Google & YouTube app: https://support.google.com/tagmanager/answer/16031492?hl=en
- Google for Developers, Shopify event parameters: https://developers.google.com/tag-platform/gtagjs/reference/shopify-event-parameters
- Google for Developers, enabling local inventory ads by default for Shopping campaigns (Jul 2026): https://developers.google.com/ads/blog/posts/2026/07/enabling-local-inventory-ads-by-default
- Google for Developers, upcoming changes to image extraction in Performance Max (Oct 2026): https://developers.google.com/ads/blog/posts/2026/10/upcoming-changes-to-image-extraction-in
- Google for Developers, Content API for Shopping deprecation and sunset: https://developers.google.com/shopping-content/guides/deprecation-and-sunset
- Google Search Central, AI features and your website: https://developers.google.com/search/docs/appearance/ai-features
- Google Search Central, optimizing for generative AI features: https://developers.google.com/search/docs/fundamentals/ai-optimization-guide
- Google Search Central, merchant listing structured data: https://developers.google.com/search/docs/appearance/structured-data/merchant-listing
- Shopify Help, profit reports: https://help.shopify.com/en/manual/reports-and-analytics/shopify-reports/report-types/default-reports/profit-reports
- Shopify Help, adding cost per item: https://help.shopify.com/en/manual/products/details/product-pricing/cost-per-item
- Shopify Help, using CSV files to import and export products: https://help.shopify.com/en/manual/products/import-export/using-csv
- Shopify Help, Google local inventory: https://help.shopify.com/en/manual/online-sales-channels/marketplaces/google/shopping-on-google/local-inventory
- Shopify Help, selling on Google AI Mode and Gemini: https://help.shopify.com/en/manual/online-sales-channels/agentic-storefronts/google
- Shopify Help, upgrading the Thank you and Order status pages: https://help.shopify.com/en/manual/checkout-settings/checkout-extensibility/checkout-upgrade
- Shopify Help, configuring customer privacy settings: https://help.shopify.com/en/manual/privacy-and-security/privacy/customer-privacy-settings/privacy-settings
- Shopify Help, analytics discrepancies: https://help.shopify.com/en/manual/reports-and-analytics/discrepancies
- Shopify Help, Shopify Flow: https://help.shopify.com/en/manual/shopify-flow
- Shopify App Store, Simprosys Google Shopping Feed (listing and reviews, read 14 Nov 2026): https://apps.shopify.com/google-shopping-feed
- Shopify App Store, Google & YouTube (listing, read 14 Nov 2026): https://apps.shopify.com/google
Vendor, practitioner and press sources (labelled as such in the text)
- Search Engine Land (Anu Adegbola), Smart Bidding update appears to have ended bid suppression (17 Sep 2026, relays vendor data): https://searchengineland.com/google-ads-smart-bidding-update-appears-to-have-ended-bid-suppression-489524
- Smarter Ecommerce (vendor), budget-limited campaigns after August 17 (23 Oct 2026): https://smarter-ecommerce.com/blog/en/google-ads/budget-limited-campaigns-after-august-17-the-roas-data/
- Smarter Ecommerce (vendor), how much data does Performance Max need (global retail data, older): https://smarter-ecommerce.com/blog/en/google-ads/how-much-data-does-pmax-need-a-data-driven-guide-to-target-roas/
- Smarter Ecommerce (vendor), why you shouldn’t segment Performance Max by heroes and zombies (27 Feb 2026): https://smarter-ecommerce.com/blog/en/google-ads/why-you-shouldnt-segment-pmax-by-heroes-zombies-in-2026/
- Search Engine Land (Menachem Ani), consolidate or segment? A Performance Max decision framework (12 Oct 2026): https://searchengineland.com/performance-max-decision-framework-494851
- Search Engine Roundtable, Performance Max no longer automatically prioritised over Standard Shopping (22 Oct 2024, secondary source): https://www.seroundtable.com/google-ads-pmax-priority-standard-shopping-38265.html
- PPC Land, Haus analysis of brand terms in Performance Max (24 Aug 2024, global, measurement firm): https://ppc.land/haus-analysis-reveals-insights-on-brand-terms-in-google-performance-max/
- Aboveclicks (agency), Performance Max versus Standard Shopping: https://aboveclicks.com/blog/performance-max-vs-standard-shopping/
- Ahrefs, schema and AI citations (vendor study, 1,885 pages): https://ahrefs.com/blog/schema-ai-citations/
- Simprosys help and vendor pages: https://simprosys.com/product-feed-app-for-shopify and https://support.simprosys.com/
- DataFeedWatch pricing: https://www.datafeedwatch.com/pricing
Calculator and worked examples are arithmetic on hypothetical numbers, not data. Examples use AUD and exclude GST.